マシンの近状
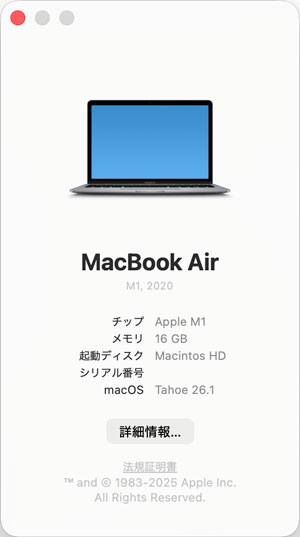
Appleシリコン M1、16GBのメモリ、1TBのSSDと20万円弱のモデルです。結構いい値段…。
アプリ開発用に環境構築して、Appleシリコン対応で苦労しましたがその後開発ツールのアップデートもあって解消。
従来のMac Book Pro 13の環境を引き継いでメインMacの立場です。
MacBook Airについて
2020年にARMベースのAppleシリコン(Apple M1)搭載の初のモデルとしてMacBook Pro 13、Mac miniと共に発売されました。
MacBook Airの現在の仕様
| 項目 | メーカー名 | 名称 |
| 機種ID | Mac Book Air 10,1 | |
| CPU | Apple | M1 高性能コア : Firestorm 3.2GHz (ARMv8.4-A/L2 12MB/4 cores) 高効率コア : Icestorm 2.0GHz (ARMv8.4-A/L2 4MB/4 cores) |
| RAM | LPDDR4X | 16GB (メモリ帯域幅 : 68.25GB/s) |
| Video | Apple | M1 8 Cores (EUs 128/ALUs 1024) |
| 液晶 | 13.3インチ Retinaディスプレイ 2,560 x 1,600ピクセル 227ppi |
|
| HDD | SSD | 1TB |
| OS | Apple | macOS Tahoe 16.1 |
メモリを16GBへSSDを1TBに増やしています。
このMacについて
 GeekBench Score
CPUの性能を測定する定番のベンチマークです。
| Model | Gateway SX3785 | MacBook Air M1 (2020) | ||
| CPU | Name | Intel Core i5-8400 (6 Cores/2.8GHz) |
Apple M1 (4 P-Cores/3.2GHz 4 E-Cores/2.0GHz) |
|
| Memory | Size | DDR4-2666 32GB | LPDDR4X-4266 16GB | |
| GPU | Intel UHD Graphics 630 (EUs 24/ALUs 192) |
Apple M1 8 Cores (EUs 128/ALUs 1024) |
||
| NPU | - | Neural Engine 16 Cores | ||
| GeekBench AI |
Single Precision Score | CPU | 3280 | 3065 |
| GPU | 1316 | 5351 |
||
| NPU | - | 3066 | ||
| Half Precision Score | CPU | 3284 | 5400 | |
| GPU | 1950 | 6447 | ||
| NPU | - | 14911 | ||
| Quantized Score | CPU | 4846 | 4423 | |
| GPU | 1837 | 5916 | ||
| NPU | - | 14562 | ||
| GeekBench 6 (Intel Core i7-12700 = 2500) |
Single-Core Score | 1403 | 2379 | |
| Multi-Core Score | 5334 | 8504 | ||
| Compute OpenCL Score | 4381 | 21538 | ||
| Compute Metal Score | - | 34116 | ||
| GeekBench 5 (Intel Core i3-8100 = 1000) |
Single-Core Score (Apple Silicon) | - | 1743 | |
| Multi-Core Score (Apple Silicon) | - | 7610 | ||
| Single-Core Score (Intel) | 1008 | 1280 | ||
| Multi-Core Score (Intel) | 4835 | 5675 | ||
| Compute OpenCL Score | 4995 | 20305 | ||
| Compute Metal Score | - | 22114 | ||
| GeekBench 4 (Intel Core i7-6600U = 4000) |
Single-Core Score | 4769 | 2734 | |
| Multi-Core Score | 19581 | 8654 | ||
| Compute OpenCL Score | 22338 | 54074 | ||
| Compute Metal Score | - | 67399 | ||
| GeekBench 3 64bit |
Single-Core Score | 3859 | 5976 | |
| Multi-Core Score | 17460 | 22306 | ||
| GeekBench 2 64bit |
Geekbench Score | - | 17644 |
 CINEBENCH
3DツールのCINEMA 4Dを開発しているMAXON社の動作パフォーマンスを測定するベンチマークです。
| Model | Gateway SX3785 | MacBook Air M1 (2020) | |
| CPU | Intel Core i5-8400 (6 Cores/2.8GHz) |
Apple M1 (4 P-Cores/3.2GHz 4 E-Cores/2.0GHz) |
|
| Memory | DDR4-2666 16GB | LPDDR4X-4266 16GB | |
| CINEBENCH 2024 | GPU | - | 1313 pts |
| CPU (Multi Core) | 350 pts | 460 pts | |
| CPU (Single Core) | 64 pts | 111 pts | |
| CINEBENCH R23.2 (2024年) | CPU (Multi Core) | 1562 pts | 6648 pts |
| CPU (Single Core) | 407 pts | 1499 pts | |
| CINEBENCH R20 (2019年) | CPU | 2199 pts | 1892 pts |
 GFX Bench
| MacBook Air Late 2020 |
iPhone 12 Pro Max | |||
| 高レベルテスト | Aztec (High Tier) | オンスクリーン | 3863.72 Frames | 1043.86 Frames |
| オフスクリーン(1440p) | 5232.06 Frames | 938.321 Frames | ||
| Aztec (Normal Tier) |
オンスクリーン | 3870.17 Frames | 1683.43 Frames | |
| オフスクリーン(1080p) | 13936.20 Frames | 2636.14 Frames | ||
| Car Chase | オンスクリーン | 3547.48 Frames | 1195.16 Frames | |
| オフスクリーン(1080p) | 10262.40 Frames | 1991.34 Frames | ||
| マンハッタン 3.1 | オンスクリーン | 3722.78 Frames | 2042.33 Frames | |
| オフスクリーン(1440p) | 7337.57 Frames | 1605.06 Frames | ||
| オフスクリーン(1080p) | 16234.10 Frames | 3236.67 Frames | ||
| マンハッタン 3.0 | オンスクリーン | 3726.42 Frames | 2997.26 Frames | |
| オフスクリーン(1080p) | 24772.80 Frames | 4668.24 Frames | ||
| ティラノサウルス レックス |
オンスクリーン | 3364.36 Frames | 3353.74 Frames | |
| オフスクリーン(1080p) | 35975.50 Frames | 7747.37 Frames | ||
| 低レベルテスト | 算術論理演算 2 |
オンスクリーン | 1824.87 Frames | 1788.05 Frames |
| オフスクリーン(1080p) | 18001.40 Frames | 7267.98 Frames | ||
| ドライブオーバーヘッド 2 |
オンスクリーン | 1804.71 Frames | 1795.55 Frames | |
| オフスクリーン(1080p) | 15991.40 Frames | 9953.34 Frames | ||
| Fill 2 | オンスクリーン | 71160 MTexels/s | 11255 MTexels/s | |
| オフスクリーン(1080p) | 70899 MTexels/s | 13131 MTexels/s |
GFX Benchは、Intel Mac側で起動できなかったのでiPhone 12 Pro Maxと比較です。
同じAppleシリコンですが、結構パフォーマンス差が出ています。
 3DMark - The Gamer's Benchmark
| MacBook Air Late 2020 |
iPhone 12 Pro Max | ||
| Wild Life Extreme Unlimited | Score | 4954 | 862 |
| Avarage frame rate | 29.7 FPS | 5.2 FPS | |
| Wild Life Unlimited | Score | 18108 | 3909 |
| Avarage frame rate | 108.4 FPS | 23.4 FPS | |
| Sling Shot Extreme Unlimited | Score | 14171 | 4386 |
| Graphics score | 27417 | 5447 | |
| Physics score | 5265 | 2807 |
Windows用ゲーマーベンチマークで有名な3DMarkです。
Mac用はリリースされていないので、iOS用のWild Lifeと、Sling ShotをiPhone 12 Pro Maxと比較してみました。
スマホとPCのグラフィックスペックの違いを感じますね。
コメント
Motorola 68KからPower PC、次にIntel x86で今回Apple シリコンとなりました。
やっとAppleがコントロールできるプロセッサを手に入れたという形でしょうか。
ベンチマークでiPhoneのパフォーマンスが良いなと思っていましたが、PCでも十分使えることを実感しました。
ただ現在のMacBook Air、MacBook Pro M1はUSBポートが少なすぎるのが難点ですね。